Dashboard in Salesforce :- In our previous Salesforce Tutorial we have learned about how to create reports in Salesforce. In this CRM Salesforce Training Tutorial we are going to learn how to create a dashboard in Salesforce with report types.
What is a dashboard in Salesforce ?
Dashboards are the pictorial or visual representation of the data that are generated from reports. By using the reports we can generate Dashboards in sfdc. Dashboard components are graphical elements. Dashboard components are those which are used to represent in graphical forms like pie chart, gauges, metrics, tables.
How to Create a Dashboard in Salesforce ?
To create a Dashboard in Salesforce follow the path.
Go to Reports tab.
Now click on New Dashboard.
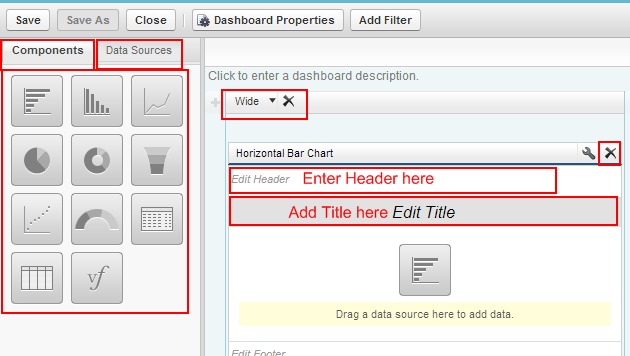
A new screen will be opened as shown below.
From above Screen we observe to section Components and Data Sources.
- Components : Dashboard Components are like pie charts, Gauges, Graphs, Tables, Funnel and so on.
- Data Source :- Data Source is the the report type to which we want to create Dashboard in Salesforce.
- Select Wide, Narrow or medium for Dashboard components size.
- Drag an Drop any of the component to left side.
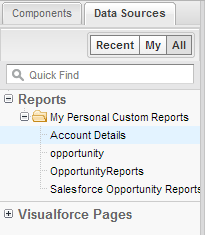
- Now go to Data source
Now select the Report from Data Sources and drag on to dashboard component.
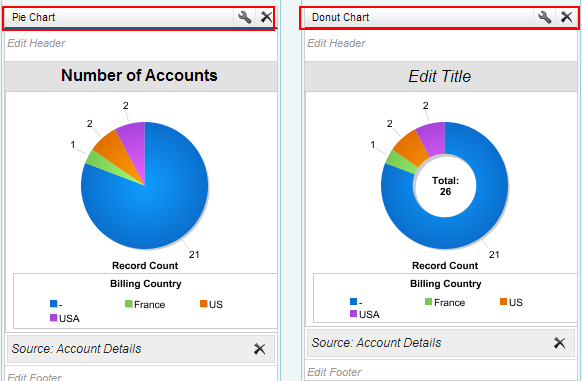
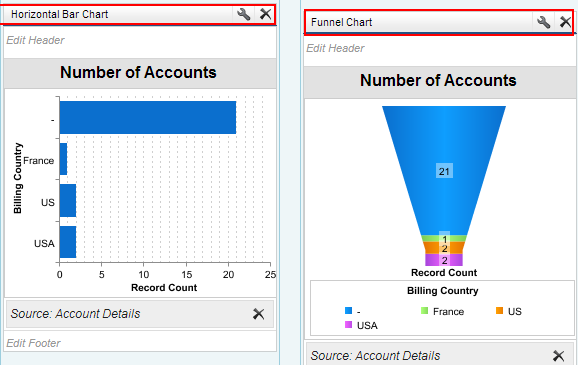
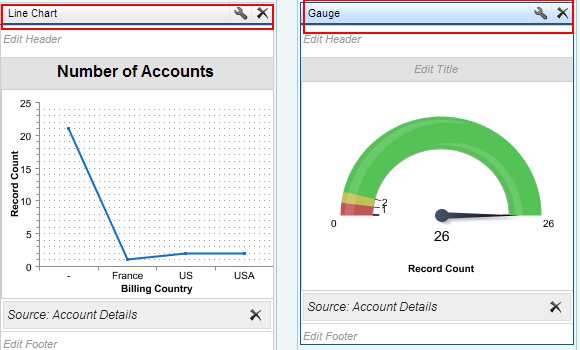
Observe above graphical representation of dashboards in salesforce.com for some report type called Account details. We can add up to 20 Dashboard components and also we can assign security permissions for folders like public, hidden, restricted to specific group or a role.
Finally Save the Dashboard.


